
Analytics & Usage
The analytics dashboard provides administrators with insights into how the organization is using nunq. All data is presented in aggregate to protect user privacy.
Accessing Analytics
- Sign in as an administrator.
- Open the organization switcher in the sidebar and pick Organization Analytics (or navigate directly to
/organization/analytics).
Analytics are only available to users with the administrator role.
Anatomy of the Dashboard
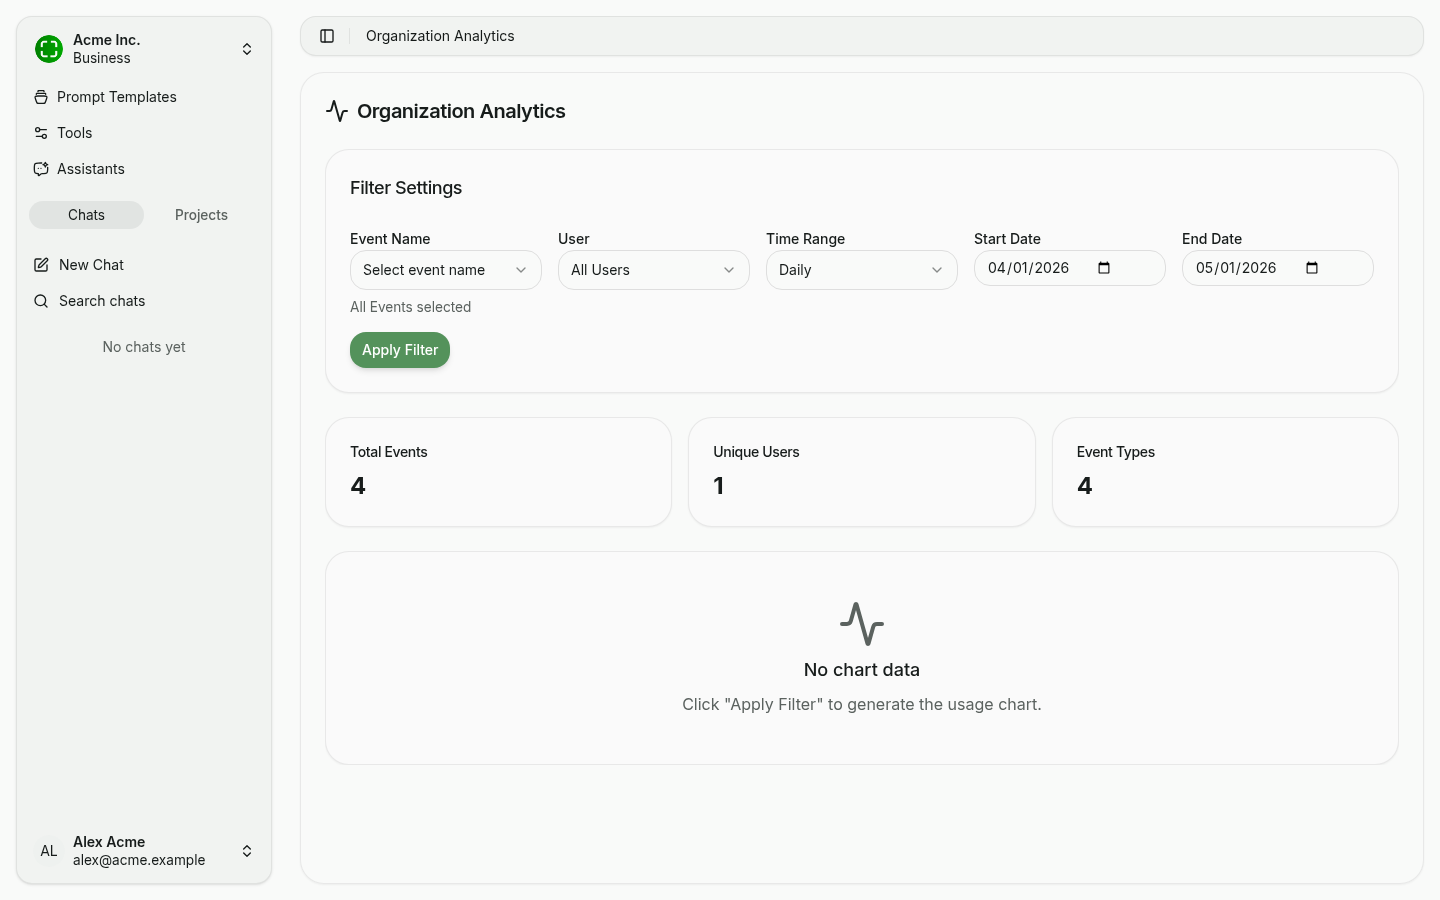
The dashboard has three blocks:
- Filter Settings — Narrow data by event name, user, time interval (Daily, Weekly, Monthly) and start/end date.
- KPI cards — Three headline numbers for the selected period:
- Total Events — Sum of all events in the period.
- Unique Users — Number of distinct users who triggered at least one event.
- Event Types — Number of distinct event types.
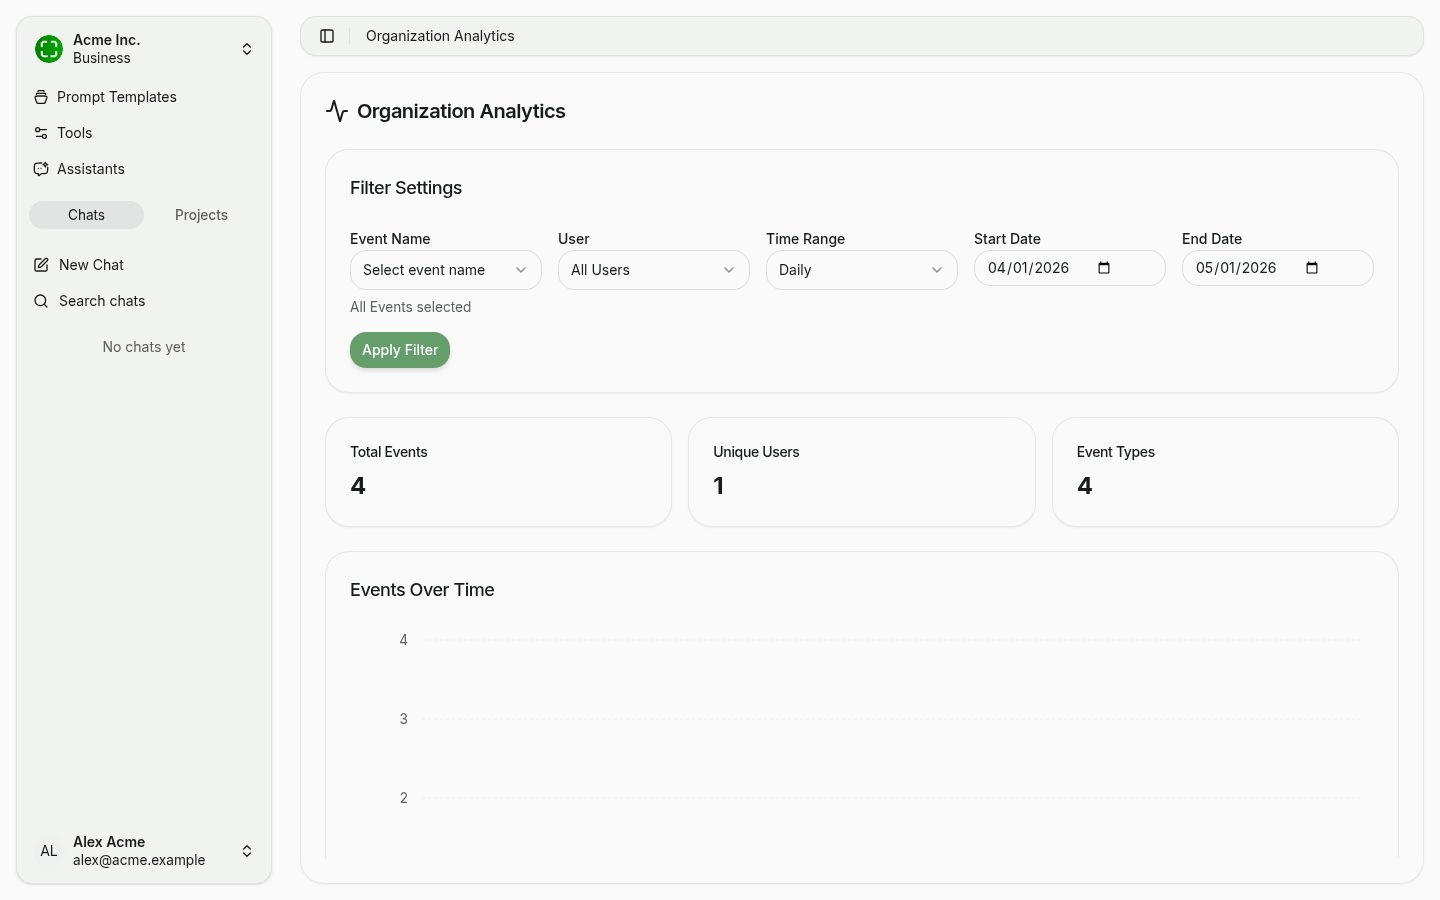
- "Events Over Time" chart — Activity trend at the chosen interval. Renders once you click Apply Filter.
Token Consumption
The Models page shows how many tokens your organization is consuming per model. The dashboard breaks down token usage by:
- Model: See which models are used most frequently and which consume the most tokens.
- Time period: View trends over days, weeks, or months.
This information helps you understand your AI spending and plan capacity.
Feature Utilization
Use the event picker in the filter to see which features are being used across your organization, including:
- Number of conversations created
- Tool and integration usage
- Assistant usage patterns
Date Range Filtering
All analytics views support date range filtering. Use the date picker to select a custom time range, or choose from preset intervals such as Daily or Weekly.
Privacy and Anonymization
User data in the analytics dashboard is anonymized. Administrators can see aggregate usage patterns but cannot see the content of individual conversations. This design ensures that users can interact with the AI without concerns about surveillance.
Specific privacy measures include:
- Individual conversation content is never displayed in analytics.
- Usage metrics are aggregated at the organization level.
- User-level data, when shown, is limited to usage counts and does not include message content.